Comprehensive Insights…

Priority’s BI – business intelligence application and analytics tools are built as an integrated part of the application. Users can quickly and easily drill-down with a single click – from aggregated data presented in dashboards and dynamic BI reports directly to the underlying data elements in their respective Priority forms.
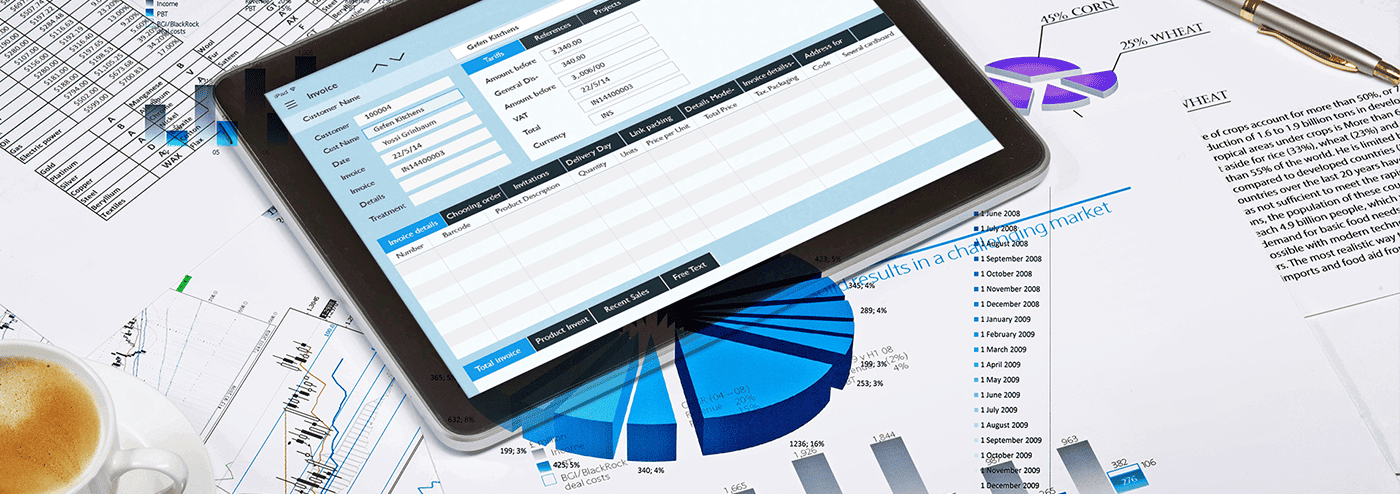
Users have the freedom to independently tailor reports and dashboards, add and personalize shortcuts and business metrics, and easily compare and contrast data of all types, including financial, sales and marketing, customer support and more.

Main Features Include

  • Superior business analytics software includes:
    • Select from a host of available dashboard components and position them in their personalized dashboard. Dashboard components can include:
      • data analytics
      • shortcuts to frequently used Priority forms and menus
      • shortcuts to your Priority calendar
      • shortcuts to external websites and feeds
    • Define your own parameters for the initial content to display when you enter a BI report (e.g., date range, company)
    • Dynamic slice and dice and drill-down functionality
    • Export results to a variety of formats, including Word and Excel
    • E-mail analytics results with a single click

Benefit from real-time business intelligence analytics with mobile access to your personalized dashboard and BI reports (including slice and dice functionality).

Profit from a true BI software experience – use ODBC to integrate third-party business intelligence tools with Priority‘s database. Many Priority partners have already developed such analytics integration, including QlikTech (QlickView), Business Objects, Cognos and others.

Get insights to make accurate and timely business decisions and eliminate guesswork.

Successfully track KPIs by getting alerts and notifications every time data changes regarding a specific KPI. If the data changes, you get notified and can drill down to see why it happened and what can you do to fix it.

Identify new revenue opportunities. By being able to analyse all your data, you will obtain insights about potential opportunities you might have missed in the past. You can create new offers to adjust to the current market situation and to better satisfy your customers.

Extended Business Intelligence (BI)

The Executive Reports module provides a broad view of company activities and contains BI report options to compare data from different years, periods and companies and a variety of dashboard display data in interactive mini-windows (“web part”) giving users instant access to critical data.

Calculated for given periods, data can be viewed from various perspectives (e.g. per part, per customer) with varying levels of detail. The module also contains monthly summaries in a variety of cross-sections.